Based on the quantum mixing effect of diamond Nitrogen-Vacancy (NV) centers, the Revealer G2110M/C_Pro high-speed camera was employed to continuously acquire fluorescence time series of NV centers at a frame rate of 1000 fps. Combined with CW-ODMR (Continuous-Wave Optically Detected Magnetic Resonance), FFT (Fast Fourier Transform) spectrum analysis, and wide-field microscopy, synchronized visualization of microwave frequency, intensity, and phase information was achieved within a field of view (FOV) of 1350×1350 μm. This provides experimental means with high temporal and spatial resolution for near-field detection and fault localization of microwave chips. This study demonstrates the application value of high-speed cameras as optical readout devices in NV center wide-field quantum imaging. For detailed research results, please refer to the link: doi.org/10.1109/TIM.2024.3480213
With the development of communication, radar, and radio frequency (RF) technologies, microwave chip structures are evolving toward high integration and miniaturization. Traditional test methods based on S-parameters, power gain, and noise figures can evaluate overall device performance but struggle to achieve high-resolution, multi-information synchronized visualization of microwave field distributions on the chip surface.
As a solid-state quantum sensing unit, the diamond Nitrogen-Vacancy (NV) center can respond to external microwave fields through changes in its electron spin state, enabling optical readout via fluorescence signals. A research team led by Professors Li Zhonghao, Tang Jun, and Liu Jun from North University of China proposed a synchronized wide-field imaging scheme for microwave signal frequency, intensity, and phase using a high-speed camera. Utilizing the “mixer” characteristic of NV centers, the microwave signal under test and a reference microwave signal are applied simultaneously to the NV centers, converting high-frequency microwave information into low-frequency fluorescence oscillation signals.
The role of the high-speed camera as a scientific camera in the experimental system is twofold: first, to record NV center fluorescence images; and second, to fully preserve the dynamic fluorescence process containing encoded microwave frequency, intensity, and phase information, enabling every spatial pixel to independently participate in subsequent frequency domain analysis and phase calculation.
Therefore, the core issue of wide-field quantum imaging systems has gradually shifted from “whether detection is possible” to “whether large-scale quantum fluorescence time-series data across the entire field of view can be stably read out and synchronously parsed.” The high-speed camera plays a critical role in this readout stage.
The experiment utilized a diamond NV center wide-field microscopic imaging system, comprising a 532 nm laser excitation module, a microwave loading module, a bias magnetic field module, a fluorescence collection module, a high-speed camera, and a data processing and simulation module.
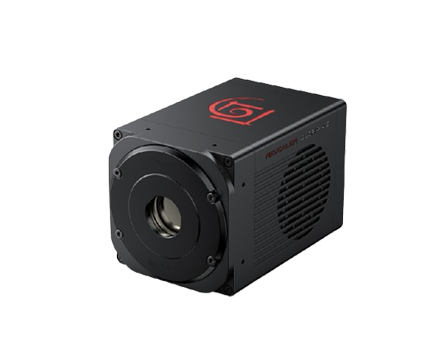
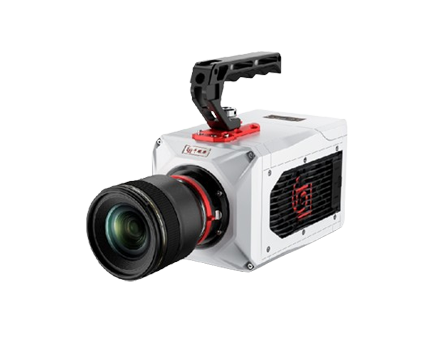
The high-speed camera selected was the Revealer G2110M/C_Pro. In full-frame mode, it continuously acquired NV center fluorescence images at a frame rate of 1000 fps. A dichroic mirror was placed in front of the high-speed camera to filter out the 532 nm excitation light, collecting only red fluorescence signals in the 620-750 nm range. The camera recorded the evolution of fluorescence intensity over time for each pixel point as a sequence of Tif grayscale images, providing the data basis for subsequent frequency, intensity, and phase calculation. The high-speed camera serves as the sole optical readout device for fluorescence time series in this quantum imaging system.
The CW-ODMR spectrum of the NV center system was measured under a fixed bias magnetic field. The magnetic field was applied along the NV center axis, obtaining two resonance peaks located at approximately 2.81 GHz and 2.95 GHz. Subsequent experiments used the 2.95 GHz resonance peak as the measurement operating point to ensure the NV center has maximum response slope to microwave field changes.
The microwave signal under test and the reference microwave signal were loaded simultaneously. After acting on the NV centers, they generated beat frequency modulation, causing the fluorescence signal to exhibit periodic oscillations related to the microwave frequency difference. With a high speed camera frame rate of 1000 fps, the camera continuously recorded the fluorescence intensity of all pixel points within the field of view, forming a fluorescence time series Tif image stack.
For each spatial pixel position, the fluorescence time series acquired by the high-speed camera underwent FFT (Fast Fourier Transform) processing to obtain the corresponding spectrum. By extracting the spectral amplitude at the target frequency position, the spatial distribution of microwave frequency was obtained.
The fluorescence oscillation time-domain signal of each pixel point was phase-compared with a reference signal to obtain the spatial phase distribution.
Through pixel-by-pixel calculation, 2D distribution images of microwave field frequency, intensity, and phase were obtained. Quantitative evaluation employed the Structural Similarity Index Measure (SSIM) and Peak Signal-to-Noise Ratio (PSNR), comparing against COMSOL simulation results to assess measurement image quality.
In this experiment, the high-speed camera was not used merely to record experimental phenomena but undertook the function of optical readout for fluorescence time series in the NV center quantum imaging system. Its output pixel-by-pixel fluorescence time series constitutes the sole source of raw data for subsequent FFT frequency calculation, quantitative microwave intensity analysis, and synchronized phase calculation. It is the key data node connecting the quantum response of NV centers with 2D microwave field reconstruction.
Figure 1 demonstrates the core value of the high-speed camera in the entire measurement system.
Figure 1(a) shows continuous TIF grayscale images acquired by the high-speed camera; Figure 1(b) shows the fluorescence time variation curve extracted from the grayscale data; Figure 1(c)displays the process of FFT analysis and microwave field distribution reconstruction.
The experiment further verified that:
Microwave frequency changes cause changes in fluorescence oscillation frequency;
Microwave intensity changes cause changes in fluorescence oscillation amplitude;
Microwave phase changes cause phase shifts in fluorescence oscillation.
This indicates that the high-speed camera records dynamic quantum signals containing encoded multi-dimensional microwave information.
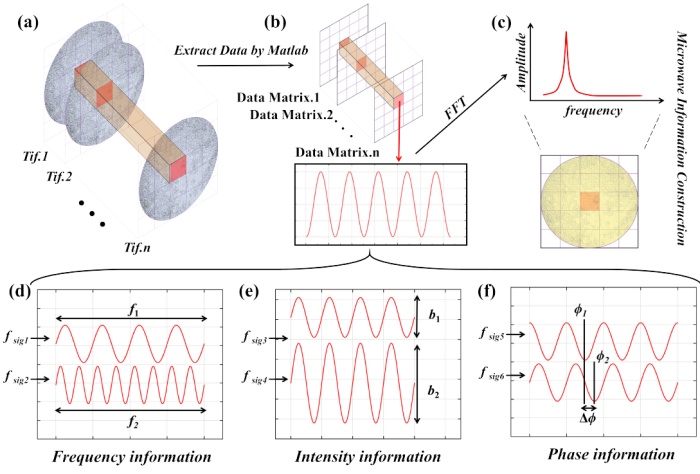
Figure 1 - High-speed camera continuously acquires NV center fluorescence grayscale images. Through pixel-by-pixel fluorescence time series analysis and FFT processing, extraction of microwave frequency, intensity, and phase information is achieved.
The experiment set the frequency difference between the reference microwave and the microwave under test to 0.1, 1, 10, 100, and 200 Hz. The high-speed camera continuously acquired the corresponding fluorescence changes.
The results showed that the spectral peak positions obtained via FFT were consistent with the set frequency differences, proving that high-speed fluorescence time series acquisition can accurately recover microwave frequency information. Ultimately, the system achieved a frequency resolution capability better than 1 Hz. The key tasks of the high-speed camera are: first, to provide a sufficiently high time sampling rate so that weak fluorescence beat frequencies can be accurately captured; second, to ensure stability during long-term continuous acquisition, providing a reliable data foundation for frequency domain analysis.
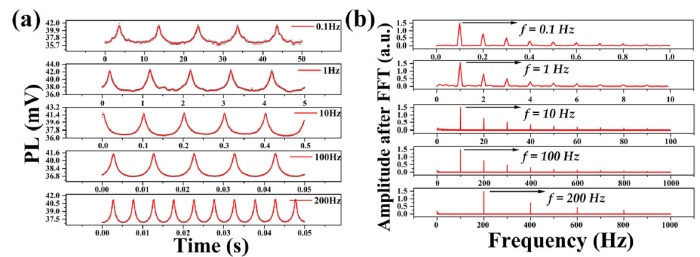
Figure 2 - High-speed camera acquires NV center fluorescence beat signals and achieves high-precision identification of different microwave frequency differences through FFT spectrum analysis
Figure 3 compares COMSOL simulation results with NV microscope experimental results.
Figure 3(a) is the COMSOL simulated microwave field distribution, and Figure 3(b) is the microwave frequency distribution reconstructed from fluorescence data acquired by the high-speed camera. The experimental results show good consistency in spatial distribution trends between the two.
This result proves that the high-speed camera can not only record single-point dynamic signals but also simultaneously preserve microwave responses at multiple spatial locations across the entire field of view.
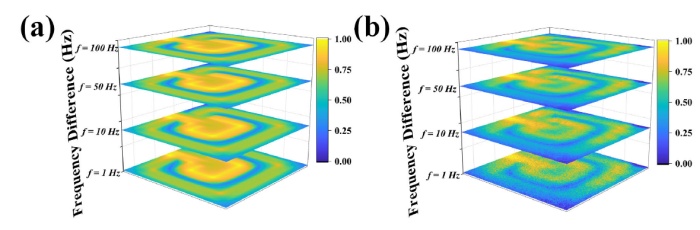
Figure 3 - Microwave frequency distribution reconstructed based on wide-field fluorescence time series from the high-speed camera, compared with COMSOL simulated microwave field results for spatial consistency.
Figure 4 establishes the relationship between fluorescence oscillation amplitude and microwave field strength. The experiment verified the linear relationship between fluorescence variation amplitude and microwave intensity under different microwave intensity conditions. The high-speed camera provides stable grayscale variation measurement, enabling weak fluorescence modulation to be converted into quantitative amplitude information.
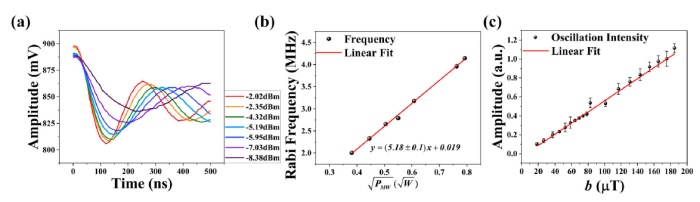
Figure 4 - High-speed camera acquires NV center fluorescence oscillation amplitude and establishes a quantitative response relationship with microwave field strength.
Subsequently, utilizing high-speed wide-field time series acquisition data, the magnetic field intensity distribution on the microwave chip surface was obtained and compared with COMSOL simulation results. Figure 5 shows that the experimental measurement can accurately reflect the microwave field enhancement phenomenon in the chip metal trace areas.
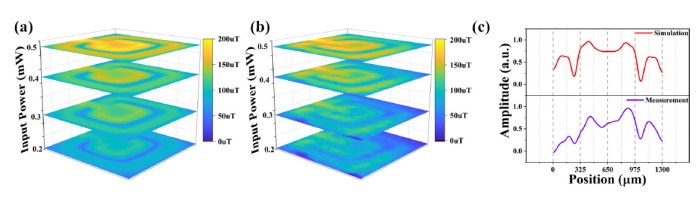
Figure 5 - High-speed camera acquires NV fluorescence amplitude variations and reconstructs the magnetic field intensity distribution on the microwave chip surface, verified by comparison with COMSOL simulation results.
The experiment altered the initial phase of the input microwave, and the high-speed camera synchronously recorded fluorescence changes at different spatial locations. Since the entire field of view was exposed simultaneously by the same high-speed camera, strict time consistency was maintained between different pixels, allowing direct comparison of phase differences. The experiment obtained a maximum phase error of < 2.8°. This result indicates that the high-speed camera not only improves sampling speed but, more importantly, provides the time base required for wide-field synchronized measurement.
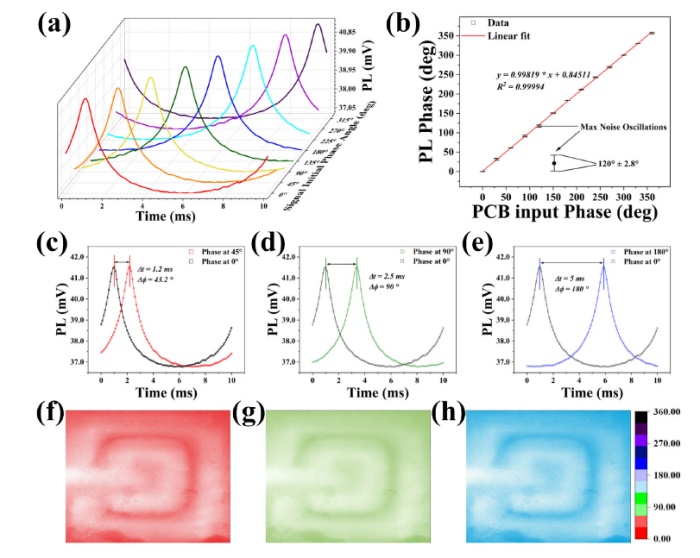
Figure 6 - High-speed camera synchronously acquires NV center fluorescence time series under different microwave phase conditions, achieving 2D microwave phase distribution reconstruction.
This study innovatively combines the diamond NV center quantum mixing effect with Revealer G2110M/C Pro high-speed camera wide-field fluorescence time series acquisition to construct a synchronized imaging system for microwave frequency, intensity, and phase, achieving parallel visualization of multi-parameter electromagnetic fields on microwave chip surfaces.
Experimental results show that the Revealer G2110M/C Pro high-speed camera, a 21 megapixel camera operating at 5120×4096 @ 1000 fps, serves as the physical recording carrier for time-domain fluorescence signals, provides traceable original sequence data support for FFT frequency calculation, intensity extraction, and phase comparison. It acts as the bridge between quantum sensing response and NV center quantum imaging results. Through comparisons with COMSOL simulation results under different frequencies and powers, it is verified that this imaging system can serve as a high temporal resolution optical readout platform in NV center quantum imaging systems, providing a unified data acquisition foundation for quantum imaging, quantum sensing, microwave near-field microscopy, and non-destructive testing of advanced electronic devices.
PREV
 English
 Deutsch