We marked a tuning fork engraved 128 Hz, yet three frequencies were measured: 103 Hz, 128 Hz and 205 Hz. Why does this happen?
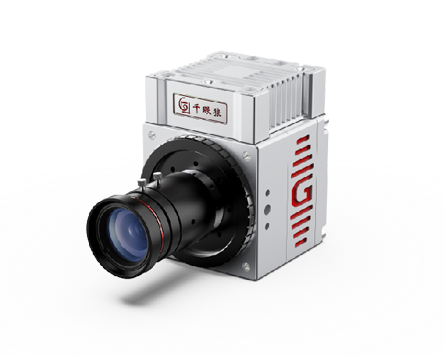
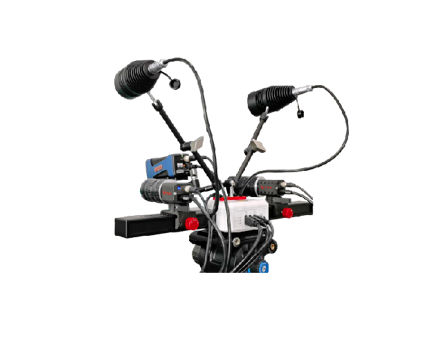
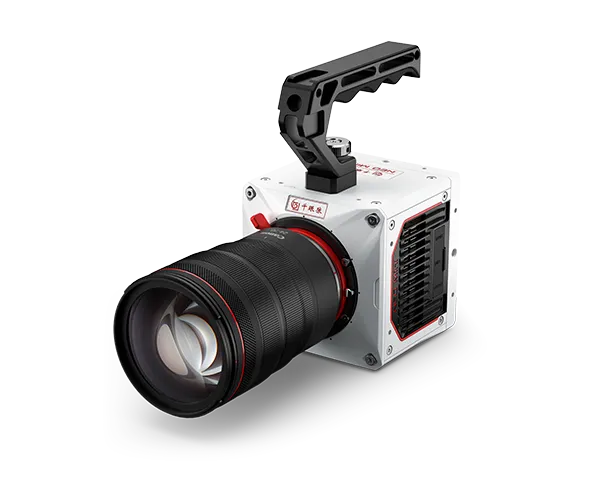
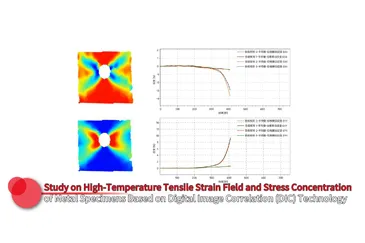
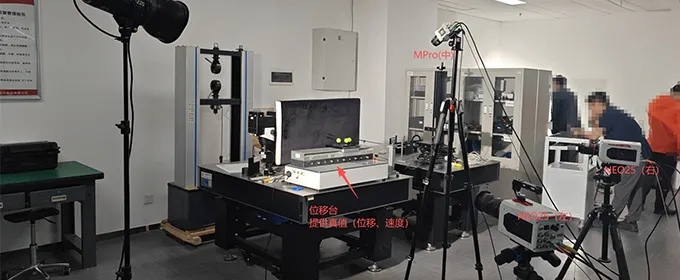
In this video, we adopt a Revealer high-speed camera combined with Digital Image Correlation (DIC) technology to conduct vibration modal analysis on a standard 128 Hz tuning fork. The full workflow is documented, including speckle marking, system calibration, data acquisition and post-processing calculation.
Frequency domain curves are reconstructed via RVM software, revealing three distinct vibration modes:
This demonstration showcases the strengths of DIC: full-field measurement and non-contact detection. We also clarify the critical difference between **frequency** and **vibration mode**.
128 Hz is not the only resonant frequency; it is merely the mode easiest to excite and most efficient at radiating sound.
Ideal audience: enthusiasts of physics experiments, high-speed videography, DIC technology and vibration modal analysis.
Like, save and share this video!
Leave a comment: How many resonant frequencies do you think a 440 Hz tuning fork will produce?


 English
 Deutsch